What 20 months of AI adoption measured
This is the honest story of 20 months going from Copilot autocomplete to relying on agents for most of the work — what we expected, what blindsided us, and what you can take from it. The numbers went up and something broke.
TL;DR
- The win: Per-engineer throughput doubled (~2×) while median cycle time stayed flat.
- The cost: Change-failure rate doubled (~17%) as batch sizes grew from 2 to 10 PRs per release.
- The surprise: Review time was the bottleneck first — not writing code. AI overproduced; humans couldn’t keep up.
The setup
We’re building a platform for real-time quality analysis of video streams, built on Spring Boot, Kafka and AWS infrastructure. A fairly complicated but not too big system. Within those 20 months we had 3 distinct periods regarding our code-assissting tools:
| Era | Period | Tooling |
|---|---|---|
| Pre-agent | 2024.10 - 2025.06 | GitHub Copilot inline · Claude chat for design questions |
| Agent-assisted | 2025.07 - 2025.11 | Claude Code used rarely on pilot tasks |
| Agent-driven | 2025.12 - 2026.05 | Claude Code as the default for most non-trivial work |
What went well
In the pilot phase, the agent touched 1.8% of commits (7 of 396). At agent-drive phase that number jumped to 53% (1,088 out of 2,053 commits).
When the trailer crosses 50%, the agent is the default — not an occasional helper. Real adoption is probably closer to 100%.
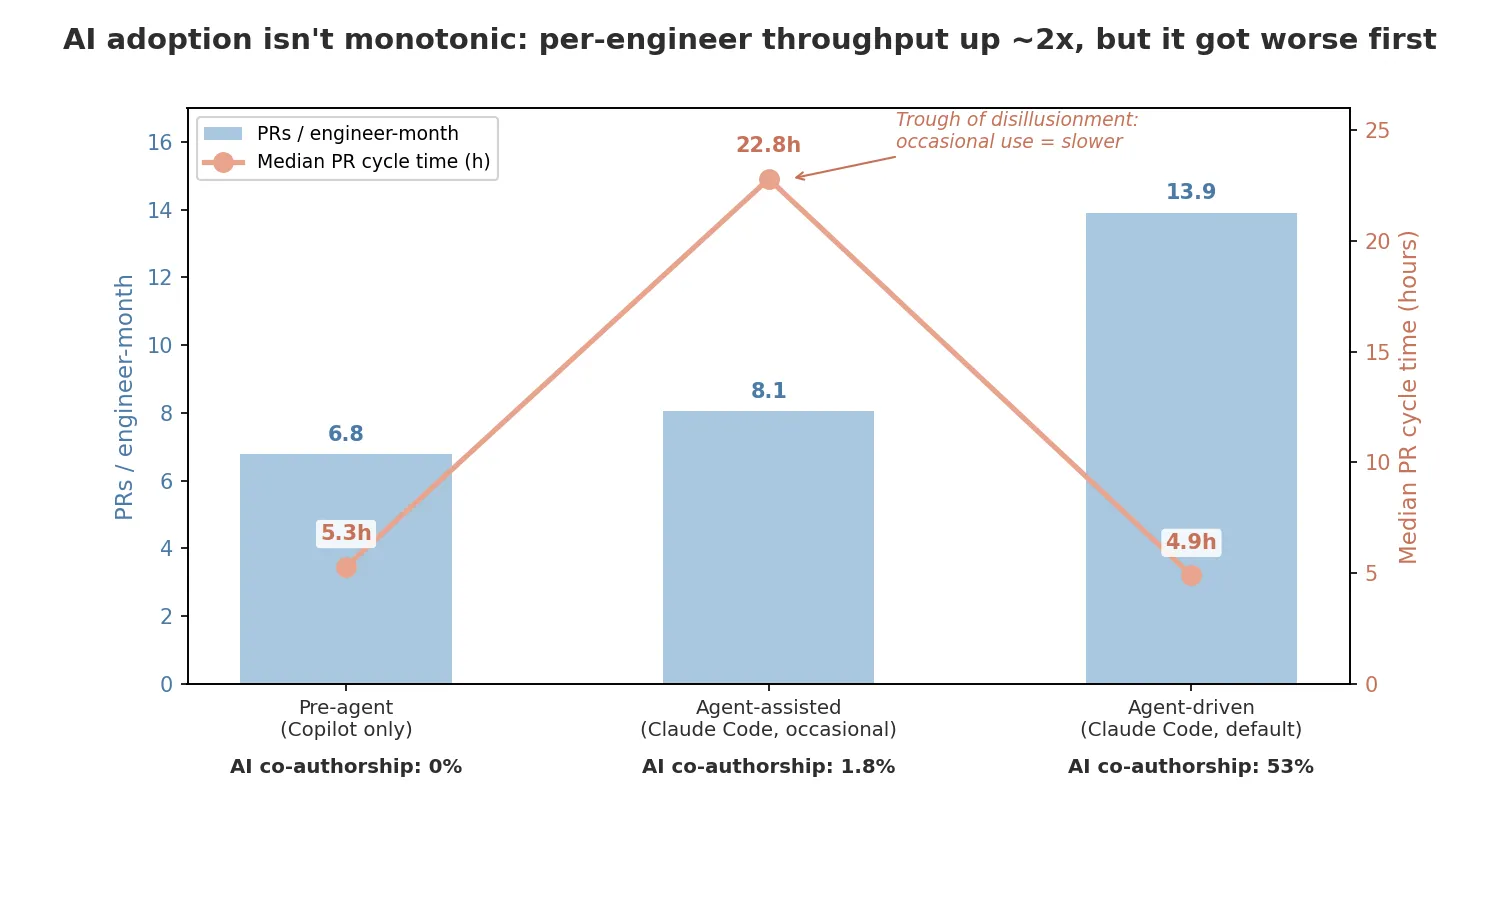
Per-engineer throughput gradually increased : 6.8 → 8.1 → 13.9 PRs / engineer-month (~2× across the three eras).
What I can’t rule out: the team grew ~5× while the share of senior engineers fell to ~25% — changes that should drag per-engineer throughput down. Yet it doubled. So the gain wasn’t just a stronger team or the team leveling up; it came from how we worked.
The surprise bottleneck
For about five months, the numbers got worse — median PR lifecycle time jumped 4×, from 5.3h to 22.8h.
The cause was mechanical. Agents started producing bigger PRs faster than humans could review them, and we were still learning how to drive them — when to reach for an agent, how to scope its work, what to put in AGENTS.md. The PRs were lumpy and piled up waiting for a human.
A pilot that makes a core metric worse usually gets killed. (This is the Trough of Disillusionment, at team scale.) We kept going because we believed there was a better way.
AI producing more and adding engineers (we grew from 1 to 11 contributors) normally stretches review queues even further. But we managed to keep the review wait flat despite the doubled PR count.
- Median PR cycle time: 5.3h → 4.9h. Effectively flat.
We achieved that by relying more on automated agent review — different models with slightly different instructions. Initially Copilot reviews were either off or nitpicking, but with some fine-tuning, we got more and more valuable feedback. By the agent-driven era, AI generated roughly half the review activity per PR — Copilot directly plus AI-drafted human-account replies.
What about quality?
Production deploy data (AWS App Runner health) tells the other half of this “going fast with AI” story.
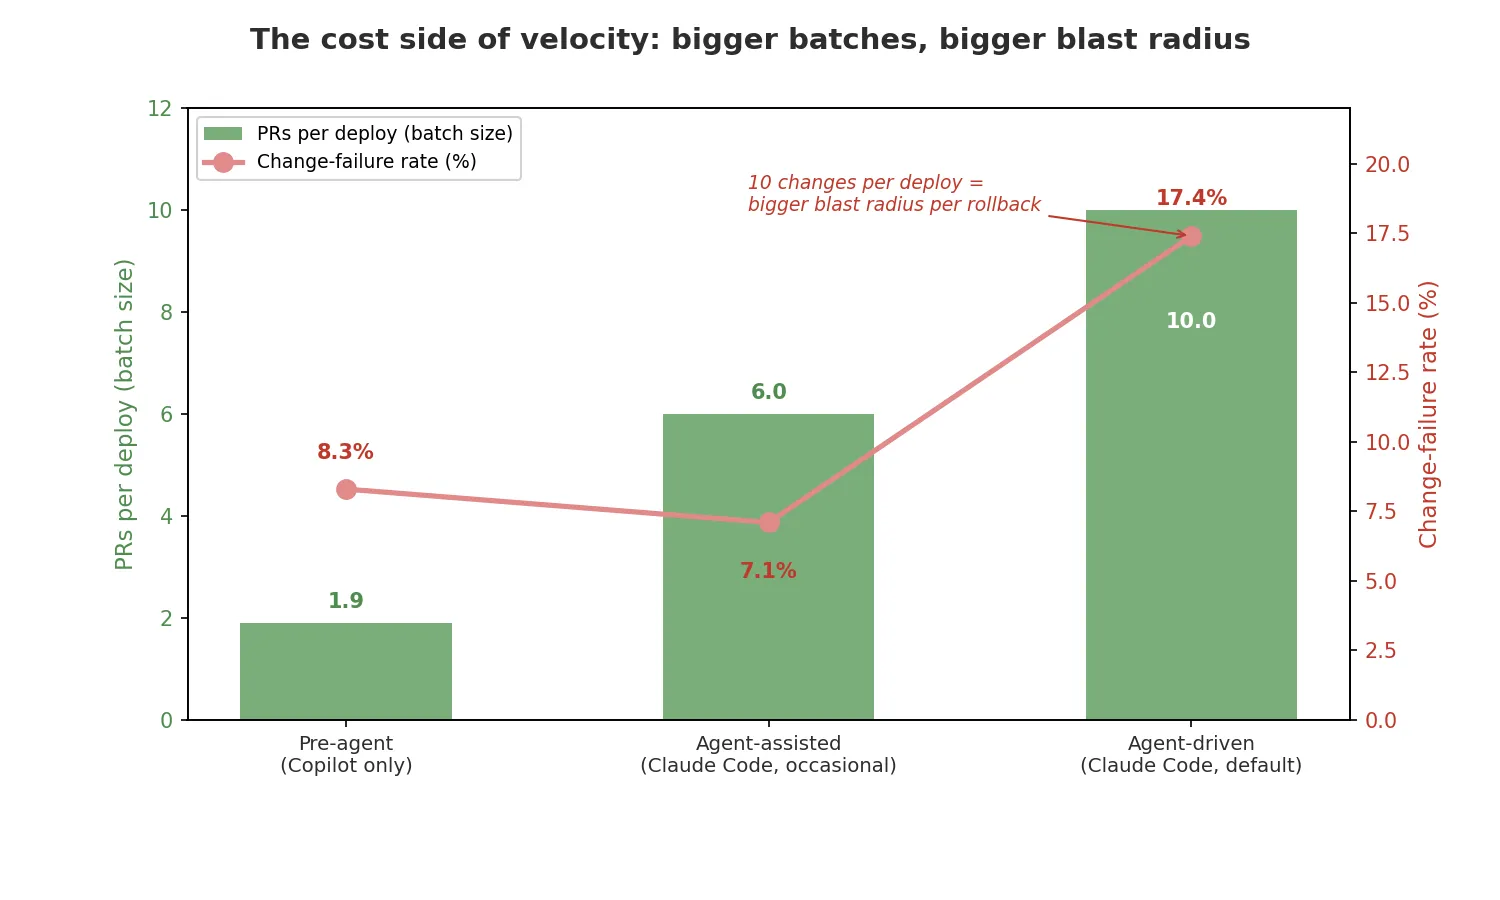
Change-failure rate tracked batch size almost 1:1 — the chart's two lines move together.
Releases grew from ~2 to ~10 PRs — so one bad change now pulls a whole release back. We measured our deployment auto-rollbacks:
Change-failure rate (rollback %): from ~8% to ~17%. The rollback rate doubled.
We shipped faster and in bigger, riskier chunks.
The takeaway
The 2× throughput increase is real.
The 2× change-failure rate is also real.
The surprise bottleneck was human reviews.
AI made us fast — and quality didn’t keep up fast enough. Fast and correct aren’t mutually exclusive.
The speed-vs-quality tension sharpens, not softens, as the agent gets better. Only an AI reviewer can keep up with an AI coder. But this led to fast overreliance on the AI reviewer and no clear ownership when we start regressing.
The gut feeling of “we are going fast and everything is fine” needs to be measured. The old saying — “if you don’t measure it, you can’t manage it” — is as true as ever.
ThoughtWorks independently evaluated using coding throughput as a productivity metric in April 2026 . They propose a better signal : first-pass acceptance rate. It would have caught our CFR regression sooner.
AI didn’t remove the bottleneck. It moved it — from writing code, to reviewing it, to keeping quality up. This is what my future posts are going to deal with.
Coming up in this series:
- When AI reviews AI: review patterns and guardrails that scale with how much the agent is writing.
- How to cut failure rate without losing speed — what would actually move the CFR back down without giving up the throughput.
P.S. — what would prove me wrong: if CFR falls back on its own next quarter without throughput dropping, quality self-corrected and “be deliberate about it” wasn’t the lesson.
Methodology & limitations (click to expand)
Metrics here follow DORA’s four keys (throughput, lead time, change-failure rate, MTTR) as defined by Forsgren, Humble & Kim in Accelerate (2018). MTTR is omitted because no consistent incident-start timestamp existed before the agent-driven era. The release-size → failure-rate mechanism is straight out of Accelerate’s chapter on continuous delivery.
Data sources
- Git history (
git log) across the 3 actively deployed repos that make up the platform. - PR metadata via the GitHub API (
gh pr list --json). - Production deploys via AWS App Runner
list-operations. - Per-PR review comment counts via the GitHub Pulls API.
Window boundaries
- Pre-agent — from first commit through the months before Claude Code was introduced (~9 months). Copilot era.
- Agent-assisted — between Claude Code being introduced and Claude Code becoming the default (~5 months).
- Agent-driven — from Claude Code becoming the default through the end of the measurement window (~6 months).
- Both boundaries are post-hoc reconstructions, identified by reading commit messages and PR titles for the inflection points.
Metric definitions
- Throughput — merged PR count per engineer-month, where engineer-month = (month × distinct PR-merging author). Squash-merged PRs count once.
- Cycle time —
mergedAt − createdAtper PR, per-window median. Cancelled and draft PRs excluded. - AI co-authorship rate — commits with
Co-Authored-By: Claudetrailer / total commits, per window. Floor, not ceiling. - PRs per release — distinct merged PRs in a given prod deploy / deploy count for that window.
- Change-failure rate —
START_DEPLOYMENToperations followed byROLLBACK_SUCCEEDEDon the same service / totalSTART_DEPLOYMENT. Lower bound on real operational failures — but a true rate for “deploys that didn’t reach steady state.”- Episodic vs systemic (W3): the 8 rollbacks across 46 deploys all fall in Mar–May 2026 (3 in March, 1 in April, 4 in May); Dec–Feb had zero. March was the worst rate (3 of 8 deploys, 37.5%); by May it had settled to ~17% across 23 deploys. The failures concentrate in the high-change months, not spread evenly. (Rollback count is App Runner’s, a lower bound on real failures; the archive doesn’t attribute each rollback to a cause.)
Things worth knowing
- Squash-merge confounds raw commit counts. PR-based metrics (throughput, cycle time, release size) are robust to it.
- Team-growth numbers are coarse. “11 concurrent at peak” is the maximum distinct PR-merging authors in any single month. Median monthly was ~4. Per-engineer throughput is computed against distinct-author-months as a proxy.
- The
Co-Authored-By: Claudetrailer is opt-in. Engineers using Claude Code without the auto-trailer setting don’t show up in the 53% number. - “Human comments” in PR data is account-based, not authorship-based. As Claude usage grew, engineers (myself included) posted AI-drafted replies into Copilot review threads. Those count as “human” in any bot-vs-human split. The bot-account count (Copilot) is a floor on AI’s review share; the ceiling isn’t bounded.