What AI actually changed in 20 months of building a real-time video stream quality platform
Adoption curves aren’t monotonic. Pilots measured too early lie to you. The only numbers worth posting are the ones that survive their own caveats.
🎯 TL;DR
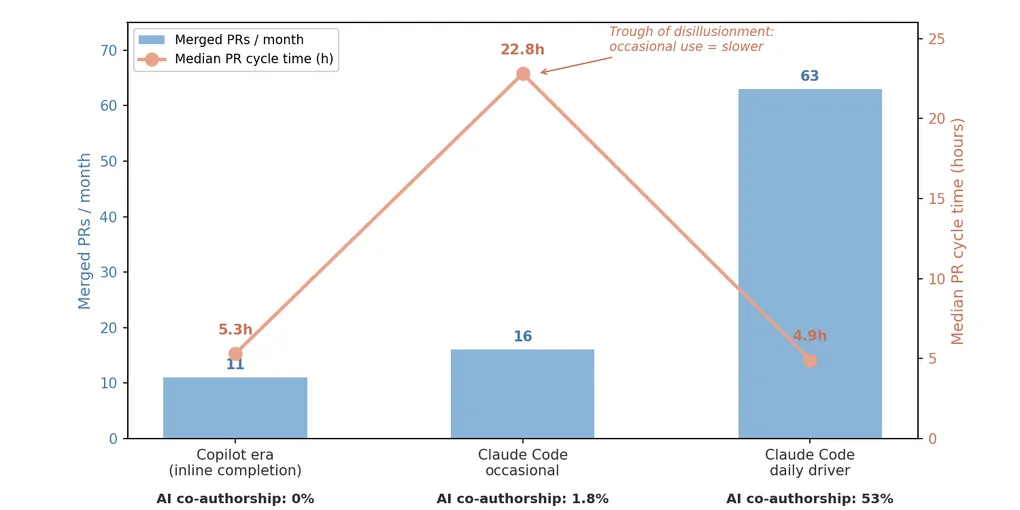
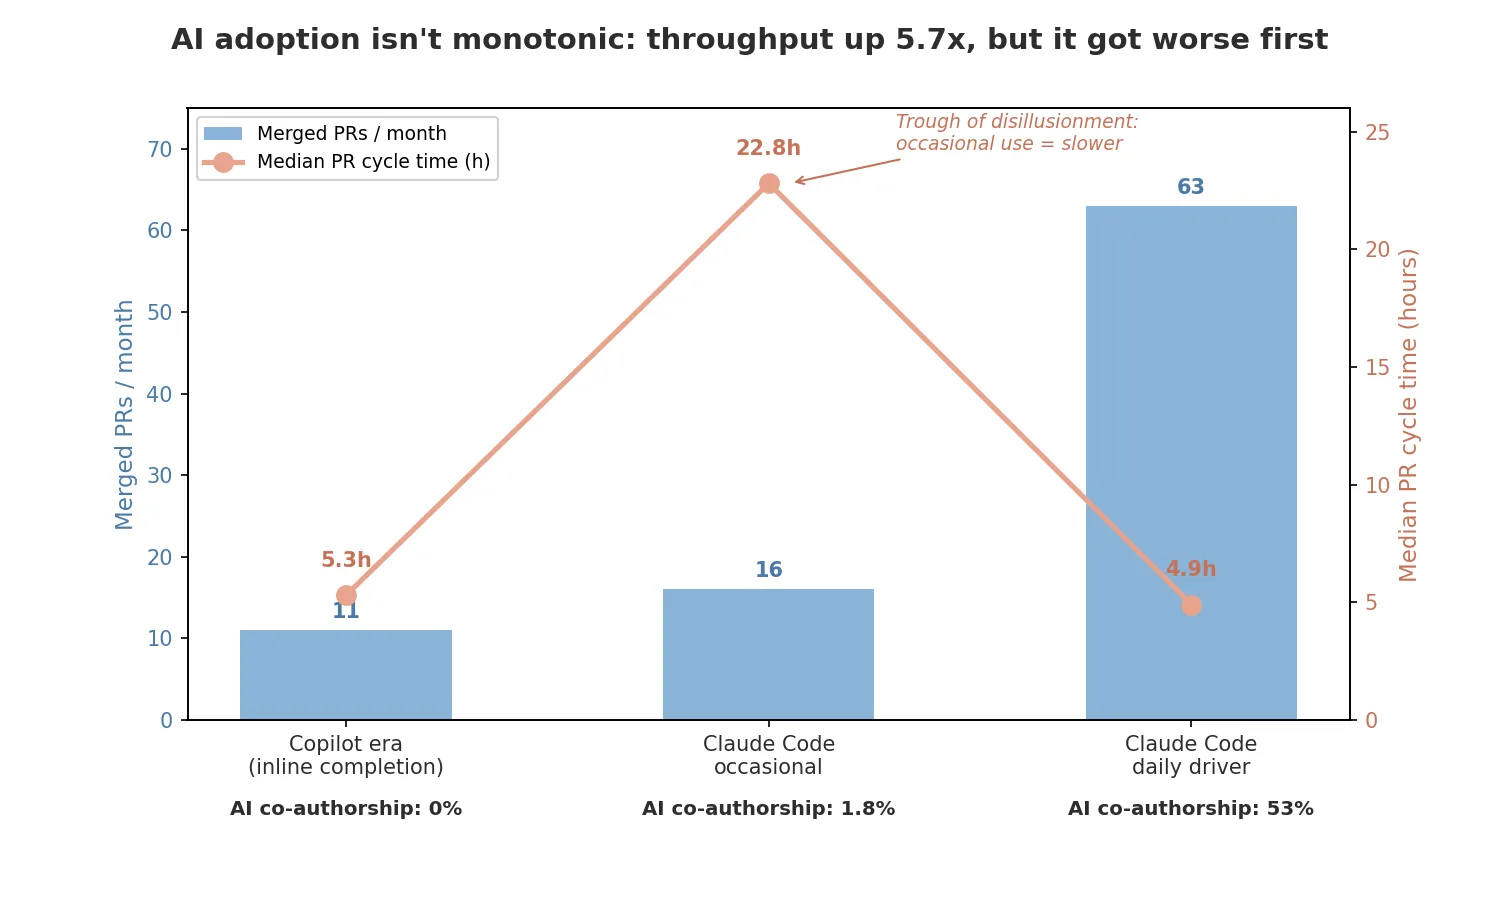
- Throughput up 5.7× — 11 → 63 merged PRs/month, at flat cycle time (5.3h → 4.9h), through a 4× team expansion.
- Adoption: 0% → 53% of commits carry an AI co-authorship trailer within six months of Claude Code becoming the daily driver.
- The middle window got worse first. Cycle time quadrupled to 22.8h in the occasional-use era — the Trough of Disillusionment, live in one team’s git history.
- Change-failure rate doubled (~8% → ~17%) because batch size grew from ~2 to ~10 PRs per deploy. We shipped faster and in bigger, riskier chunks.
- What I’d do differently: instrument before the rollout, not after.
🏗️ The setup
- A platform for real-time quality analysis of video streams — pulling sub-second HLS segments from upstream providers, running quality-detection passes (black-screen, silence, score-graphic OCR, latency observation), aggregating SLA breaches into a per-fixture timeline.
- Stack: Java / Spring / Kafka / AWS. In production from April 2025.
- Team grew from 1 engineer (me) to 15+ by May 2026.
- I pulled 21 months of git, PR, and production-deploy history, bucketed into three AI-adoption eras:
| Window | Dates | Tooling era |
|---|---|---|
| W1 | 2024-09 → 2025-06 | GitHub Copilot only · Claude in a browser tab for design questions |
| W2 | 2025-07 → 2025-11 | Claude Code introduced, used occasionally |
| W3 | 2025-12 → 2026-05 | Claude Code as the daily driver |
W1 is partly asserted, not measured — Copilot leaves no commit fingerprint. Only from W2 onward (when Claude Code started signing commits) does adoption become directly measurable.
📈 The two numbers that survive every caveat
Throughput grew 5.7× at flat cycle time
- 11 → 63 merged PRs per month.
- Team expanded ~4× over the same window.
- Per-engineer throughput rose ~1.4× — not the interesting number.
- The interesting number: median PR cycle time stayed flat at ~5 hours through that 4× growth. Quadrupling a team normally wrecks review latency. It didn’t.
- Most plausible explanation: Copilot’s PR review feature touched 75% of merged PRs in W3 — AI absorbed the review-latency cost teams usually pay for headcount.
AI co-authorship reached the majority of commits
- W1: 0 of 604 commits had the
Co-Authored-By: Claudetrailer. - W2: 7 of 396 (1.8%).
- W3: 1,088 of 2,053 (53%).
- The trailer is a floor, not a ceiling — manual rebases, fixups, config edits rarely carry it. Real adoption is somewhere above 53%.
- When it crosses 50%, the agent is the default — not a tool you reach for occasionally.
🕳️ The middle window is the story
Look at the cycle-time line in the chart. It dips up sharply in the middle.
- W2 median cycle time: 22.8 hours — roughly 4× the W1 baseline.
- Mechanism: occasional agent use produces fewer, lumpier PRs — refactor + feature + config bundled. They sit in review queues longer because reviewers can’t context-switch into them quickly.
- If I’d measured the pilot only through November 2025 and stopped: the data said “Claude Code made us slower.” The pilot would have been killed.
- This is the Trough of Disillusionment from the Gartner hype cycle — except it’s inside a single team’s git history, not a market.
- The payoff came when the agent became the default, not when it was the occasional escape hatch. Daily-driver use restored small focused PRs because that’s the unit the agent operates on best.
Blog-post version of the insight: Measure pilots over long enough to clear the trough, or don’t measure them at all.
⚖️ The number that went the wrong way
Throughput is half a delivery story. I pulled production deploy data too — AWS App Runner operations, 13 months.
- The flashy headline I’m not going to use: “median time from PR merge to production fell from 89 days to 5.”
- That 89-day era predates our CI/CD pipeline. PRs sat in
mainbecause there was no automated path to production. Building the pipeline collapsed lead time — not adopting AI. Using that number as the AI headline would be the exact misattribution this post is supposed to argue against.
Apples-to-apples, with the pipeline in place, lead time didn’t improve. It’s gated by batch size, and batch size grew:

- PRs per production deploy: ~2 → ~10 (W1 → W3).
- Change-failure rate (rollback %): ~8% → ~17%.
- Same mechanism: 10 changes per deploy = bigger blast radius. One bad change pulls the bundle back.
Honest framing, without spin
- The W3 failure rate is real and roughly double the earlier baseline.
- 7 of 8 W3 rollbacks cluster in two large rollouts (multi-tenant auth + a schema migration) — episodic, not systemic.
- Every counted failure was caught by App Runner’s health checks and auto-reverted before reaching steady state — the bad version didn’t sit broken in production.
- We shipped ~3× more deploys in W3. Rollback rate doubled. Rollback count rose faster than that.
Net: we shipped faster, and we shipped in bigger, riskier chunks. That’s the cost. A post that buried it to keep a clean story wouldn’t be worth reading.
🔧 What I’d do differently
Two things, both about instrumentation cadence:
Instrument before the rollout, not after.
- Throughput was easy to measure — git records every commit, author, timestamp, diff.
- Quality was hard to measure — nobody set up the labels in advance.
- We didn’t tag
hotfix/revertPRs, so the only CFR proxy I could compute retroactively was App Runner rollbacks. That gives operational-failure data, not quality-of-shipped-code data. - An afternoon of pre-rollout instrumentation would have given me the second axis the post is currently missing.
Define windows and success criteria before you start.
- I bucketed into three eras retroactively, by reading commit messages and PR titles to figure out when Claude Code became the default. The bucketing held up, but it was hand-waved post-hoc.
- A pre-defined “evaluate this tool after N weeks of M% of devs using it on K% of PRs” criterion would make the analysis defensible to a more skeptical audience.
💡 The takeaway
The headline win — 5.7× more PRs at flat cycle time — is real. The middle-window trough is real. The doubled change-failure rate is real. Reporting any one of them without the others would be the dishonesty the rigor of the rest is supposed to earn the right to avoid.
Adoption curves aren’t monotonic. Pilots measured too early lie to you. The only numbers worth posting are the ones that survive their own caveats.
📐 Appendix — methodology & caveats
Data sources
- Git history (
git log, all 16 repos in the org). - PR metadata via the GitHub API (
gh pr list --json). - Production deploys via AWS App Runner
list-operations. - AWS Cost Explorer.
- Per-PR review comment counts via GitHub Pulls API.
Window definitions
- W1 — 2024-09-18 (first commit) → 2025-06-30.
- W2 — 2025-07-01 → 2025-11-30.
- W3 — 2025-12-01 → 2026-05-22.
- W1/W2 boundary = the month I introduced Claude Code to the team.
- W2/W3 boundary = the month I noticed it had become my default for non-trivial work.
Metric definitions
- Throughput — merged PR count per month, all repos. Squash-merged PRs count once.
- Cycle time —
mergedAt − createdAtper PR, per-window median. Cancelled and draft PRs excluded. - AI co-authorship rate — commits with
Co-Authored-By: Claudetrailer / total commits, per window. - Batch size — distinct merged PRs in a given prod deploy / deploy count for that window.
- Change-failure rate —
START_DEPLOYMENToperations followed byROLLBACK_SUCCEEDEDon the same service / totalSTART_DEPLOYMENT. Lower bound on real operational failures — but a true rate for “deploys that didn’t reach steady state.”
Caveats worth knowing
- Squash-merge confounds raw commit counts. I leaned on PR-based metrics — they’re robust to it.
- 4× team-growth normalization is honest but rough. Includes contractors and intermittent contributors.
- W1 cost data is permanently lost (Cost Explorer retains 14 months). That’s why this post avoids cost as a baseline-comparison axis.
- The
Co-Authored-By: Claudetrailer is opt-in. Engineers using Claude Code without the auto-trailer setting don’t show up in the 53% number. Real adoption is somewhere above it.
Part of the series: 20 months on a platform for real-time quality analysis of video streams. Next: Kafka clock-skew — the hotfix that became an architecture rework.